
Lite, Reusable and customizable line charts for Transformice!






- Reusable
- Lightweight
- Customizable
- Real time!
- Class based
- Easy
- Now you can add multiple Series to the same graph. Check out the documentation for more information!
--insert the library code before the script
--then call LineChart.init()
LineChart.init()
--then call LineChart(id, x, y, w, h) to create a new chart
chart = LineChart(1, 200, 50, 400, 200)
--create a new series to insert into the created chart.
series1 = Series({1,2,3}, {1,2,3}, "series1")
--add it to the chart
chart:addSeries(series1)
--set the labels to display (optional)
chart:showLabels()
--display the chart
chart:show()
-- this should show a linear chart ...
Check the documentation for more
LineChart.init() --initialzing

x = range(-5, 5, 0.5)
y = map(x, function(x) return math.tan(x) end)

chart = LineChart(1, 200, 50, 400, 200) --instantiation
series1 = Series(x, y, "y = tan x", 0xFFCC00) -- creates a new series with yellowish-orange color
chart:addSeries(series1)
chart:setGraphColor(0xFFFFFF, 0xFFFFFF) --sets graph color to white
chart:show() --display the chart

LineChart.init() --initializing

x = range(-5, 5, 0.5)
y = map(x, function(x) return 2 * x * x end)

chart = LineChart(1, 200, 50, 400, 200) --instantiation
chart:addSeries(Series(x, y, "y = 2x^2", 0xCC89FF)) --adds a new series with color purple
chart:setGraphColor(0xFFFFFF, 0xFFFFFF) --sets graph color to white
chart:show() --display the chart

Real time Graphs!
LineChart.init()

chart = LineChart(1, 200, 50, 400, 200) --instantiation
series1 = Series({0}, {0}, "Real time", 0xDD32CC) --creates a new series
chart:setGraphColor(0xFFFFFF, 0xFFFFFF) --sets graph color to white
chart:addSeries(series1) --adds the new series

currX = 0
--the real time mageic is here!
function eventLoop(l, r)
	local x = range(currX, currX + 10, 0.1) --creates the x coordinates
	local y = map(x, function(x) return  math.sin(x) * x * x * math.tanh(x) end ) --maps x values to the specified function
	series1:setData(x, y) --set new data to the series
	chart:show() --displays it
	currX = currX + 0.5 --this cause x coordinate to move by 0.5 every 500ms
end
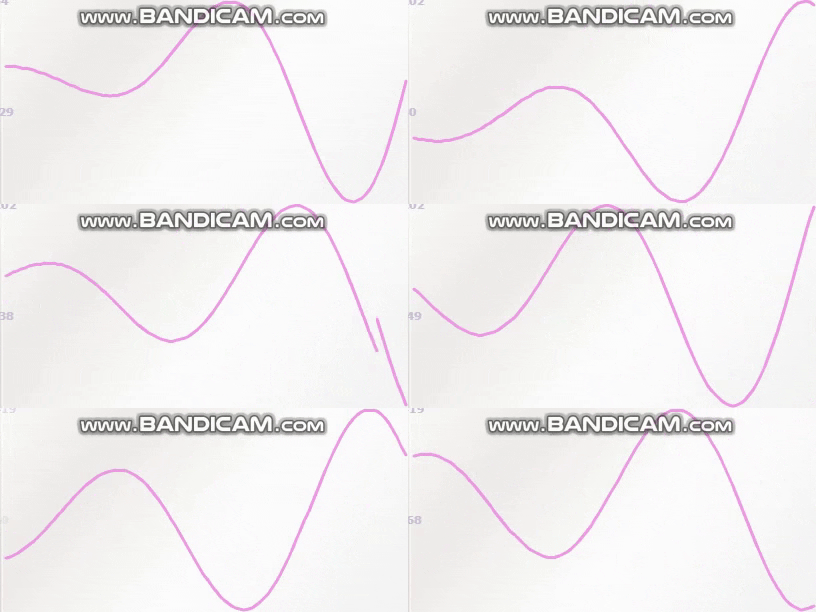
Multi-Series Graphs!
LineChart.init()

chart = LineChart(1, 200, 50, 400, 200) --creates the chart (container for the series)
chart:setGraphColor(0xFFFFFF, 0xFFFFFF) --sets graph color to white
xData = range(0, 20, 1)  --creates a list of numbers from 0 to 20

series1 = Series(xData, xData, "linear") --creates a linear series
series2 = Series(xData, map(xData, function(x) return math.cos(x) end), "y = cos x") --creates a series which maps 'y' values to the 'tan x' value
series3 = Series(xData, map(xData, function(x) return math.random(x) end), "random") --creates a series which maps 'y' values randomly to 'x'

--add all the series
chart:addSeries(series1)
chart:addSeries(series2)
chart:addSeries(series3)

chart:showLabels() --show the labels
chart:show() --show the plots!

Thanks goes to these wonderful people (emoji key):
 Seniru Pasan Indira 💻 📖 🎨 |
 Lautenschlager 💻 |
This project follows the all-contributors specification. Contributions of any kind welcome!