


AutosRUs’ newest prototype, the MechaCar, is suffering from production troubles that are blocking the manufacturing team’s progress. AutosRUs’ upper management team would like to review the production data for insights that may help the manufacturing team.
- The goal is to identify which variables predict the MPG
- Determine summary statistics on the PSI of the suspension coils
- Design a study to compare the MechaCar against other manufacturers' vehicles
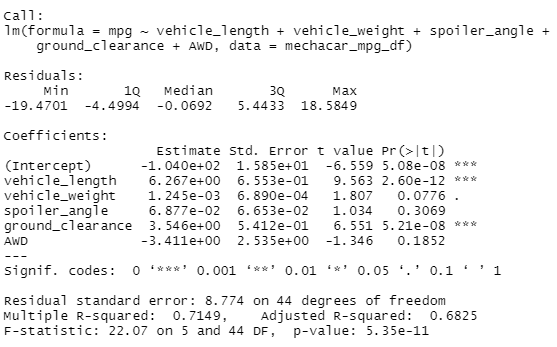
- There are 2 variables with large effect on the MPG for the MechaCar. The "Vehicle Length" has a p-value of 2.60x10^-12 and "Ground Clearance" has a p-value of 5.08x10^-8.
- The entire linear model has a p-value of 5.35x10^-11. This value has no level of significance; therefore the null hypothesis should be rejected.
- This model yields an R-squared value of 0.7149 which is about 71% accuracy. This is not a horrible accuracy value, but it can be improved.

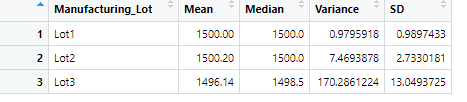
- The total variance is 62.3 which is within specifications. However, the variance for Lot 3, as shown in the table above, is 170.28. This is way over the acceptable threshold implying there is a problem with Lot3.
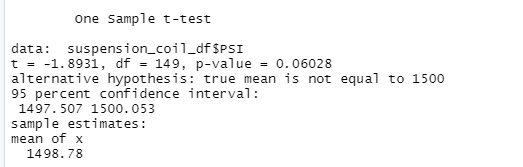
- The p-value yielded from a cumulative t-test is 0.0603. This value is not low enough to reject the null hypothesis
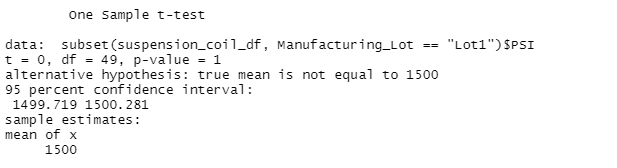
- After reviewing the results of the t-test ran for Lot 1, the p-value is 1. This result indicated the difference is not significant from the population mean therefore, we cannot reject the null hypothesis.
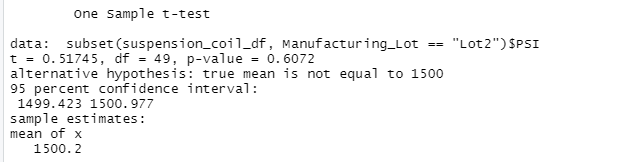
- After reviewing the results of the t-test ran for Lot 2, the p-value is 0.607. This value is not low enough for us to reject the null hypothesis.
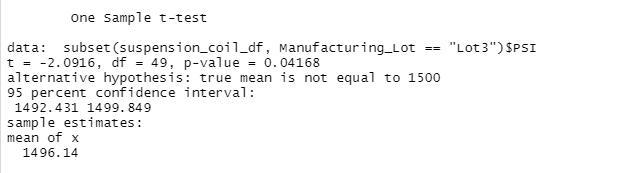
- After reviewing the results of the t-test ran for Lot 3, the p-value is 0.0417.
- Due to the R-squared value of this lot, it may need further investigation to be use accurately.
- Many variables are accounted for when purchasing a vehicle. Fuel efficiency, storage size, and reliability are top of the list. In order for the MechaCar to stand amongst the competition a few more analysis may need to be ran in order to optimize sales.
- In order to test the main priorities of customers, an analysis on the storage capacities should be done. The MechaCar's trunk space should be around the size of competitors without compromising fuel efficiency.
H0: MechaCar prototypes' average carrying capacity is similar to competitor's vehicles in the same vehicle class Ha: MechaCar prototypes' average carrying capacity is statistically above or below that of competitor vehicles.
The ideal statistical test would be a two-sample t-test because it would effectively show if the MechaCar's mean is similar to the competitions.
In order to run this analysis, we would need to gather data about the area of space and cubic dimensions of storage compartments. We will need data on both the MechaCar prototype and competitor vehicles.